Synthetic study · a brain-encoding model · stimuli of simulated-market studies
What a brain encoder says about a company page
Fed the six identity texts of the brand-priors study, Meta's TRIBE v2 predicted cortical maps whose first two components changed the held-out log loss of the choice model by −0.009 against the baseline, and the model's own backbone features by +0.008: backbone beats cortex. The maps themselves behave: a spoken text lights the superior temporal and inferior frontal parcels, a storefront screen the occipital ones, and a blank screen sits below the average everywhere.
Everything here is fictional and simulated. The companies, buyers and articles are the market-perception studies' inventions; the predicted responses are a model's guess about an average scanned person (TRIBE v2, CC BY-NC 4.0), not a measurement of anyone's brain. The choice outcomes are language-model personas', not real buyers'.
The maps
The time-mean of the predicted response on the inflated cortex, four views each, red where the model predicts a BOLD increase. These are the encoder's own renderings (map.png) of four of the runs.
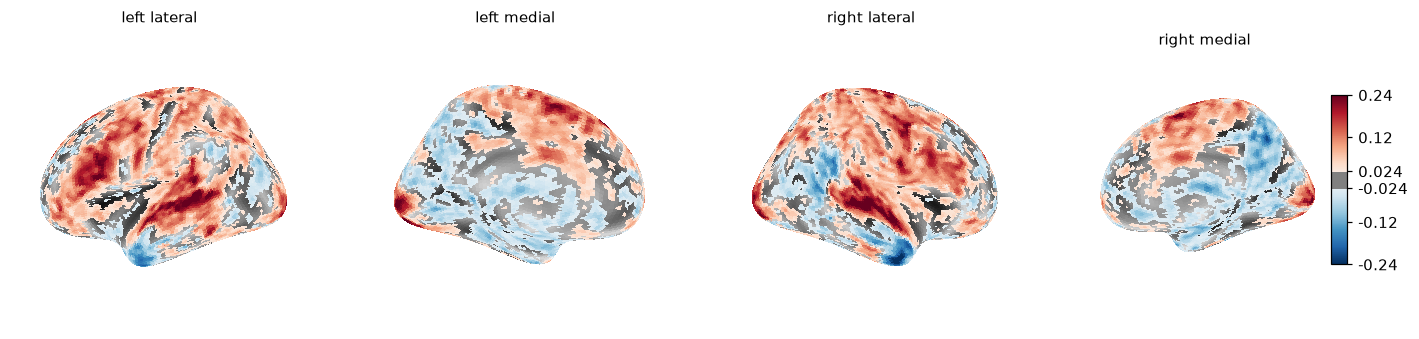
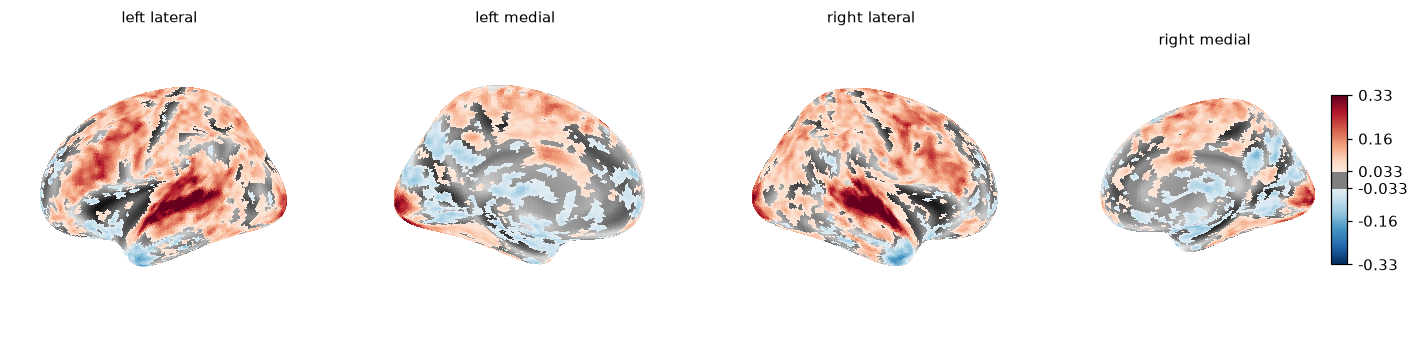
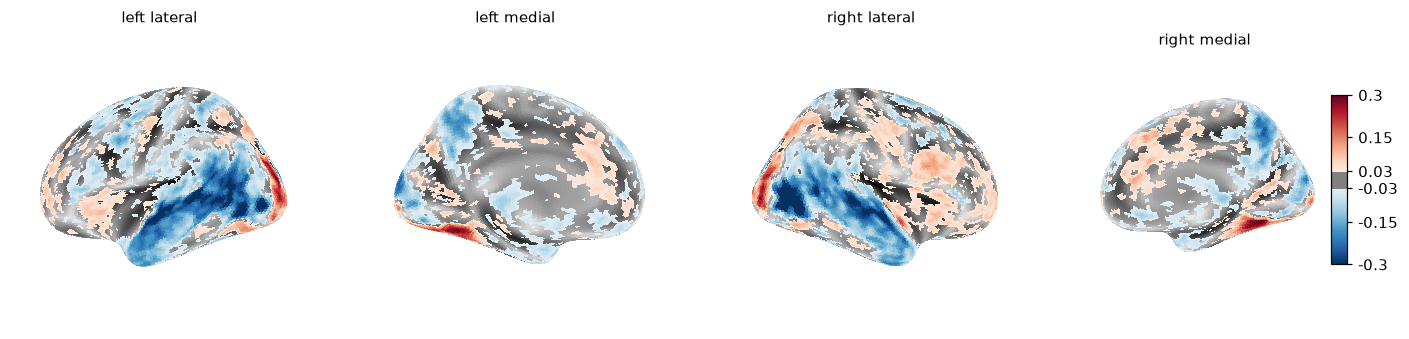
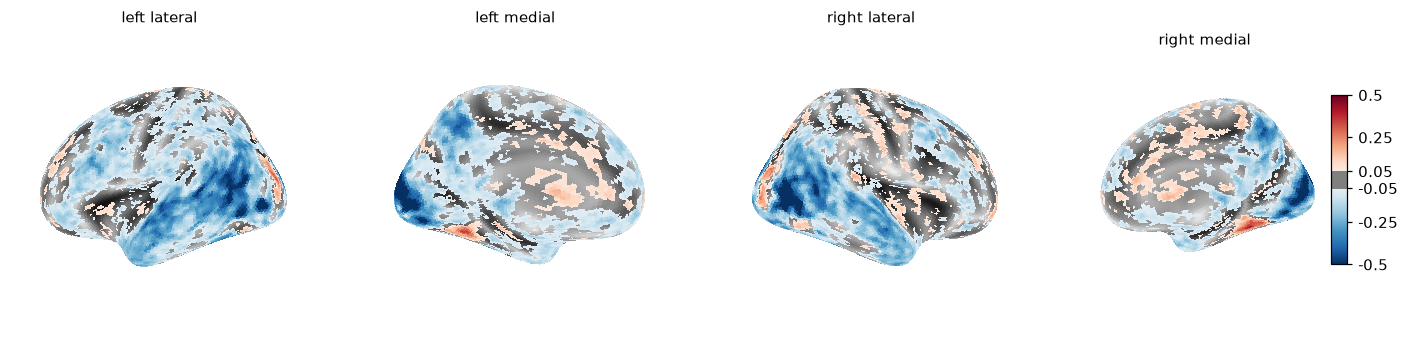
A spoken text drives the parcels where speech is heard and parsed; a screen drives the visual parcels; the blank screen sits below the model's average response in every parcel, which is the floor the storefront screens are read against. The chart below puts numbers on it.
Table view
| Stimulus | Kind | Seconds | Features | Visual mean | Language mean | Visual in top 10 | Language in top 10 | Strongest parcels |
|---|---|---|---|---|---|---|---|---|
| Control identity text (spoken) | text | 81 | audio, text | +0.029 | +0.069 | 0.2 | 0.3 | R · S temporal transverse; L · S front inf; R · G temp sup-G T transv; L · Pole occipital; L · S temporal transverse |
| Weather text (spoken) | text | 50 | audio, text | +0.058 | +0.113 | 0.2 | 0.5 | R · S temporal transverse; L · S temporal transverse; R · G temp sup-G T transv; R · G temp sup-Lateral; L · G temp sup-G T transv |
| Storefront screen, control arm | screen | 20 | audio, video | +0.014 | -0.091 | 0.5 | 0.0 | L · S collat transv post; L · S oc middle & Lunatus; R · S oc-temp med & Lingual; R · S collat transv post; R · G oc-temp lat-fusifor |
| Blank white screen | screen | 20 | audio, video | -0.141 | -0.157 | 0.0 | 0.0 | R · S oc-temp med & Lingual; R · Lat Fis-ant-Vertical; R · G & S frontomargin; R · G & S cingul-Mid-Post; L · S front middle |
The question
The market-perception studies measure what simulated buyers do with a company page, an article or a storefront. A brain-encoding model gives a different kind of number for the same stimulus: what an average person's cortex would do while reading or watching it. Does that number carry information about the market's behaviour beyond what the model's own backbone features already carry? The audit of these features as predictors (Rodrigues, 2026) found the brain projection beats its backbone on one dataset and loses on another, so the only fair test is matched: the same stimulus, with and without the projection, on a held-out outcome.
Registered before any study stimulus was encoded (preregistration.json): the primary contrast is the brand-priors choice model with two principal components of the predicted cortex per identity arm against the same with two components of the backbone, leave-one-identity-arm-out, 1,000 buyer bootstraps; the registered expectation was that neither moves held-out log loss by 0.01, because the six identity texts differ in a few dozen words and the model is fitted on five arms.
The result
Table view
| Feature set | Rows | AUC baseline | AUC with | Log-loss reduction | Low | High |
|---|---|---|---|---|---|---|
| Baseline + predicted cortex (2 PCs) | 1922 | 0.808 | 0.811 | -0.0088 | -0.0204 | +0.0031 |
| Baseline + backbone features (2 PCs) | 1922 | 0.808 | 0.820 | +0.0081 | +0.0017 | +0.0152 |
| Cortex minus backbone | 1922 | -0.0169 | -0.0253 | -0.0083 |
The predicted cortex changed held-out log loss by −0.009 (95% −0.020 to +0.003); the backbone by +0.008 (+0.002 to +0.015). Row by row, cortex minus backbone is −0.017 (−0.025, −0.008): backbone beats cortex. The first two components explain 60%, 27% of the cortex's variance over the six arms and 38%, 29% of the backbone's.
How to read this
The baseline is the brand-priors study's: the price ratio, the buyer's overall impression and two segment indicators. A feature set's score is its held-out log loss over the (buyer, arm, price) rows when each identity arm is predicted by a model fitted on the other five. A reduction is the baseline's loss minus the set's; the interval resamples buyers. The arm-level features are constant within an arm, so the test asks whether a six-point embedding of the texts generalises to a sixth text, which is the question a predictive factor must answer and the reason the registered expectation was a null.
Where the identities differ, in the predicted cortex
Each identity text is the control's with a different name, tagline and positioning sentence; the company facts and the product sheet are byte-identical. The encoder's maps differ accordingly: small, and where words are processed.
Table view
| Identity text | Largest |Δ| | RMS Δ over parcels | Control's own range | Language parcels among the top 10 Δ |
|---|---|---|---|---|
| Plant Network Devices (placebo name) | 0.062 | 0.0176 | 0.275 | 0.4 |
| Kuvra Inc. (name only) | 0.033 | 0.0099 | 0.275 | 0.4 |
| Kuvra Inc. | 0.034 | 0.0146 | 0.275 | 0.3 |
| Orume (name only) | 0.061 | 0.0204 | 0.275 | 0.6 |
| Orume | 0.030 | 0.0125 | 0.275 | 0.4 |
The launch campaign's artifacts
The six artifacts of the article brain-LTV study, as posted, against the intent lift that study measured for each arm over five seeds. Spearman's rank correlation between the language parcels' mean response and the measured lift is +0.49 over 6 arms: six points, shown for what they are.
Table view
| Artifact | Words | Seconds | Language mean | Visual mean | Intent lift per member |
|---|---|---|---|---|---|
| Article + critique | 127 | 68 | +0.1608 | +0.0512 | +0.0786 |
| Company announcement | 62 | 33 | +0.0621 | +0.0068 | +0.0571 |
| Independent article | 69 | 37 | +0.1562 | +0.0425 | +0.0571 |
| Article + discussion | 130 | 63 | +0.2115 | +0.0733 | +0.0357 |
| Founder's post | 56 | 29 | +0.0992 | -0.0255 | +0.0286 |
| Placebo post | 22 | 9 | +0.0501 | +0.1057 | +0.0000 |
Method
stimuli, the encoder, the parcels, the held-out test
Stimuli (stimuli.py): the six identity blocks of brand-priors (name, tagline, copy, the identical company facts and product sheet), the six launch-campaign artifacts of press-brain-ltv, a weather text of the control's length, the EG-400 product page as buyers-16 saw it in each arm of the storefront run (rendered by the engine from the offline replay, state hashes checked against the recorded run; the worlds of the commit the journal was recorded on), and a blank screen. Encoding (run.py, the console's own scripts/brain/encode.py): a text is spoken by a synthetic voice and transcribed back to timed words (whisperx, large-v3), a screen is held still for 20 s as a silent video; TRIBE v2 (facebook/tribev2, checkpoint 9c79ffff6b64) answers one map a second on fsaverage5 (20,484 vertices), shifted 5 s for the haemodynamic lag. Parcels are Destrieux's (nilearn); the backbone features are the time-means of what the model was given (Llama 3.2 3B for words, w2v-BERT 2.0 for audio, V-JEPA 2 for frames), caught at the model's input. Analysis (analyze.py): scripts/society/factors.py's held-out ablation, as brand-priors uses it.
What is directly computed: every map, parcel mean and backbone feature. What is a model's estimate: all of it, of an average person who never saw these pages. What is assumed: nothing in dollars; this study makes no economic claim.
Limitations
six texts, a synthetic voice, still screens, simulated buyers, an average subject
- Six identity texts give six points per feature; two components of them cannot carry much, and the registered null was the expectation. A study with dozens of distinct pages is the next test.
- A text goes through a synthetic voice; "RS-485" was spoken as "minus 485 rupees" in one transcript. The predicted response is to the speech, not to reading, and the model has no reading pathway for a screen's text beyond its pixels.
- A screen held still for 20 s is not a browsing session; the buyer scrolled, clicked and read. The storefront screens are one frame each.
- The outcomes are simulated buyers' (language-model personas). Nothing here is calibrated against a person; the calibration roadmap is the market-perception studies' (a conjoint panel), with a scanned reading study as the brain side's.
- TRIBE v2 predicts an average subject's fMRI; its correspondence with real brains is domain-specific (a NeurIPS 2026 evaluation) and weakest on affective conditions, which is where "trust" and "premium" would live.
Reproduce
four commands and the data
~/brain/cwenv/bin/python research/studies/brain-encoder/stimuli.py --out research/studies/brain-encoder/stimuli
~/tribe-env/bin/python research/studies/brain-encoder/run.py --stimuli research/studies/brain-encoder/stimuli --runs ~/brain/runs/study
python research/studies/brain-encoder/analyze.py --runs ~/brain/runs/study --out research/studies/brain-encoder/results
python research/studies/brain-encoder/page.py --check
Data: results.json, parcels.csv (every parcel of every run), index.json (each run's summary and digests), manifest.json (the stimuli's digests and the screens' replay hashes). The encoder and the hosted program: the brain encoder.